NIPS 2017 Paper Clustering Analysis
I scraped the accepted papers from the 2017 Neural Information Processing Systems Conference (NIPS) and used TF-IDF and k-means clustering to sort them into categories based on paper topic. The analysis revealed 9 distinct research clusters covering areas from generative adversarial networks to reinforcement learning optimization.
Overview
I sorted all 567 accepted papers from NIPS 2017 by topic using natural language processing and unsupervised learning techniques. The process involved:
- Data Collection: Scraped paper titles and abstracts from the NIPS 2017 conference schedule
- Text Preprocessing: Concatenated titles with abstracts and applied TF-IDF vectorization
- Similarity Analysis: Computed cosine similarity between document vectors
- Dimensionality Reduction: Used multidimensional scaling to project into 2D space
- Clustering: Applied k-means algorithm to group papers into thematic clusters
Motivation
During my time at the conference, I found myself naturally sorting papers and presentations into categories like unsupervised learning (autoencoders, clustering), supervised learning (vanilla NNs, RNNs, CNNs, GANs), and reinforcement learning. I was curious to see if machine learning techniques could replicate this human categorization process.
I also noticed papers could be grouped by the type of improvement they made: requiring less data, training faster, increasing accuracy, reducing overfitting, guaranteeing convergence, etc. This motivated me to explore whether algorithmic clustering would reveal similar patterns.
Process
The analysis was broken into three main phases:
1. Data Scraping
- Used a Python scraping script to extract titles and links from the NIPS website
- Collected abstracts by following each paper’s individual link
- Final dataset: 567 papers with complete title and abstract information
2. Data Cleaning
- Tokenization and Stemming: Broke down abstracts and titles into individual word stems using NLTK’s Snowball Stemmer
- Stopword Removal: Eliminated common words like “the”, “and”, “as” that don’t distinguish between topics
- Custom Stopwords: Added domain-specific stopwords that appeared frequently but weren’t useful for clustering:
- General ML terms: “algorithm”, “framework”, “evaluate”, “model”, “neural”, “network”
- Common descriptors: “novel”, “efficient”, “robust”, “significant”, “demonstrate”
- Process words: “approach”, “method”, “technique”, “process”, “perform”
3. Clustering and Visualization
- TF-IDF Vectorization: Converted text to numerical vectors with max_df=0.8 parameter
- K-means Clustering: Applied clustering algorithm with k=9 (determined through experimentation)
- Hierarchical Clustering: Used Ward’s method to create dendrogram visualization
- 2D Projection: Employed multidimensional scaling for scatter plot visualization
Challenges
Hyperparameter Tuning
Finding the optimal TF-IDF parameters required significant experimentation. The max_df parameter proved crucial:
- Too low (< 0.6): Excluded important but moderately frequent terms
- Too high (> 0.9): Included too many common terms, reducing cluster separation
- Optimal (0.8): Balanced meaningful term inclusion with noise reduction
Determining Cluster Count
Since papers often span multiple topics (e.g., “optimization methods in computer vision”), finding the right number of clusters was challenging:
- Lower bound (k=3): Too broad - merged distinct research areas
- Upper bound (k=15): Too granular - split related concepts unnecessarily
- Optimal range (k=7-9): Balanced topic separation with meaningful groupings
I used both quantitative measures (within-cluster sum of squares) and qualitative assessment (keyword coherence, visual separation) to select k=9.
Overlapping Research Areas
Many papers intersect multiple domains. For example, a paper on “sparse convolutional neural network optimization” could belong to:
- Computer vision (convolutional networks)
- Optimization (gradient methods)
- Sparsity (regularization techniques)
The clustering algorithm naturally grouped papers by their most dominant themes, with less prevalent topics appearing as secondary characteristics.
Outcomes
The multidimensional scaling projection below shows how the 567 papers cluster in 2D space based on their content similarity:
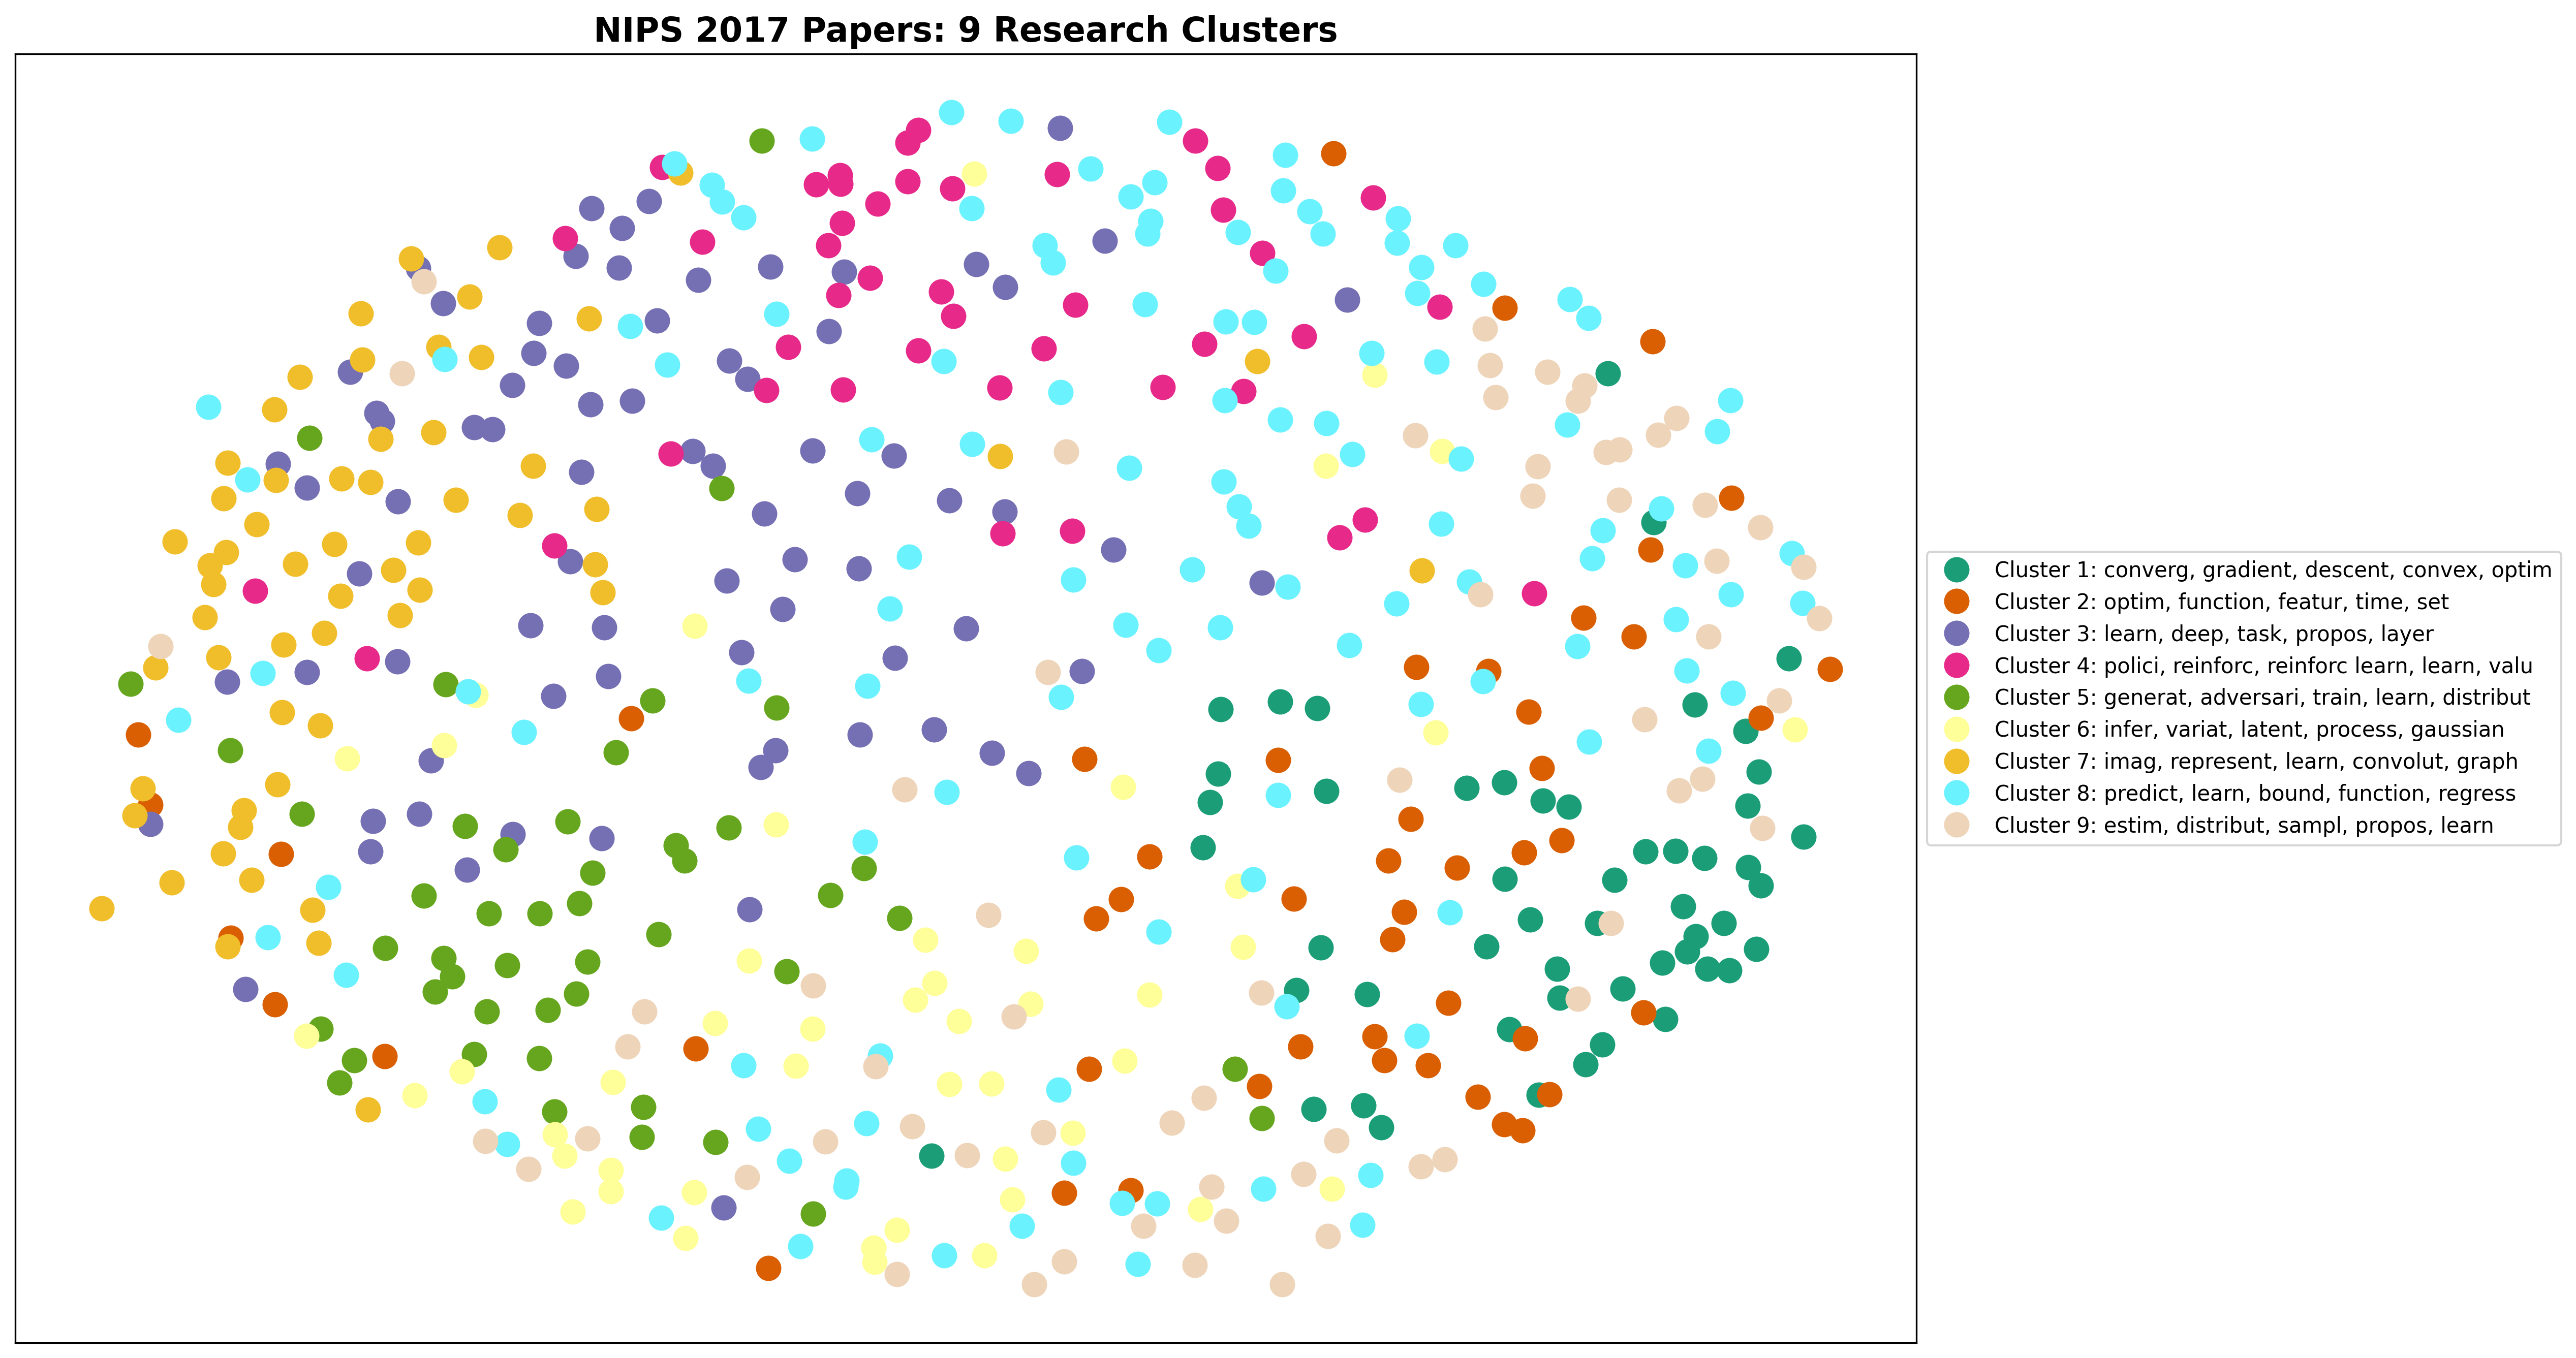
2D projection of NIPS 2017 papers using multidimensional scaling. Each point represents a paper, colored by cluster assignment. The legend shows the top keywords for each of the 9 clusters.
Cluster Analysis Results
The k-means algorithm identified 9 distinct research clusters:
- Approximation & Regression (81 papers)
- Keywords: approximation, linear, kernel, regression, empirical
- Focus: Statistical learning theory, kernel methods, linear models
- Generative & Adversarial Models (48 papers)
- Keywords: generative, adversarial, image, label, joint
- Focus: GANs, generative modeling, image synthesis
- Statistical Estimation (48 papers)
- Keywords: estimation, variables, statistics, parameters
- Focus: Bayesian methods, statistical inference, parameter estimation
- Variational Inference (62 papers)
- Keywords: inference, variational, latent, dynamical, variables
- Focus: Probabilistic modeling, latent variable models, variational methods
- Feature Learning & CNNs (142 papers) - Largest cluster
- Keywords: predictions, representations, features, convolutional, label
- Focus: Deep learning, feature extraction, supervised learning
- Graph & Probability Theory (36 papers)
- Keywords: graphs, probability, random, optimization
- Focus: Graph neural networks, probabilistic models, random processes
- Computer Vision (35 papers)
- Keywords: image, convolutional, features, input
- Focus: Image processing, computer vision applications
- Reinforcement Learning (93 papers) - Second largest
- Keywords: policy, reinforcement, dynamical, gradient, optimization
- Focus: RL algorithms, policy optimization, control theory
- Optimization Methods (22 papers)
- Keywords: optimization, gradient, convergence, descent, convex
- Focus: Optimization algorithms, convergence theory, gradient methods
Key Insights
-
Implicit Category Emergence: Terms like “supervised” and “unsupervised” didn’t appear directly in cluster keywords, but emerged implicitly through grouped concepts (e.g., “autoencoder” + “clustering” vs. “regression” + “classification”)
-
Research Volume Distribution: Feature learning/CNNs and reinforcement learning dominated the conference, reflecting 2017’s research priorities
-
Topic Associations: The algorithm successfully identified meaningful relationships:
- “Image” + “convolutional” (computer vision)
- “Policy” + “reinforcement” (RL)
- “Bayesian” + “variational” (probabilistic methods)
Hierarchical Clustering Visualization
The Ward clustering dendrogram below shows the hierarchical relationships between all 567 papers, with similar papers grouped closer together and different research areas forming distinct branches:
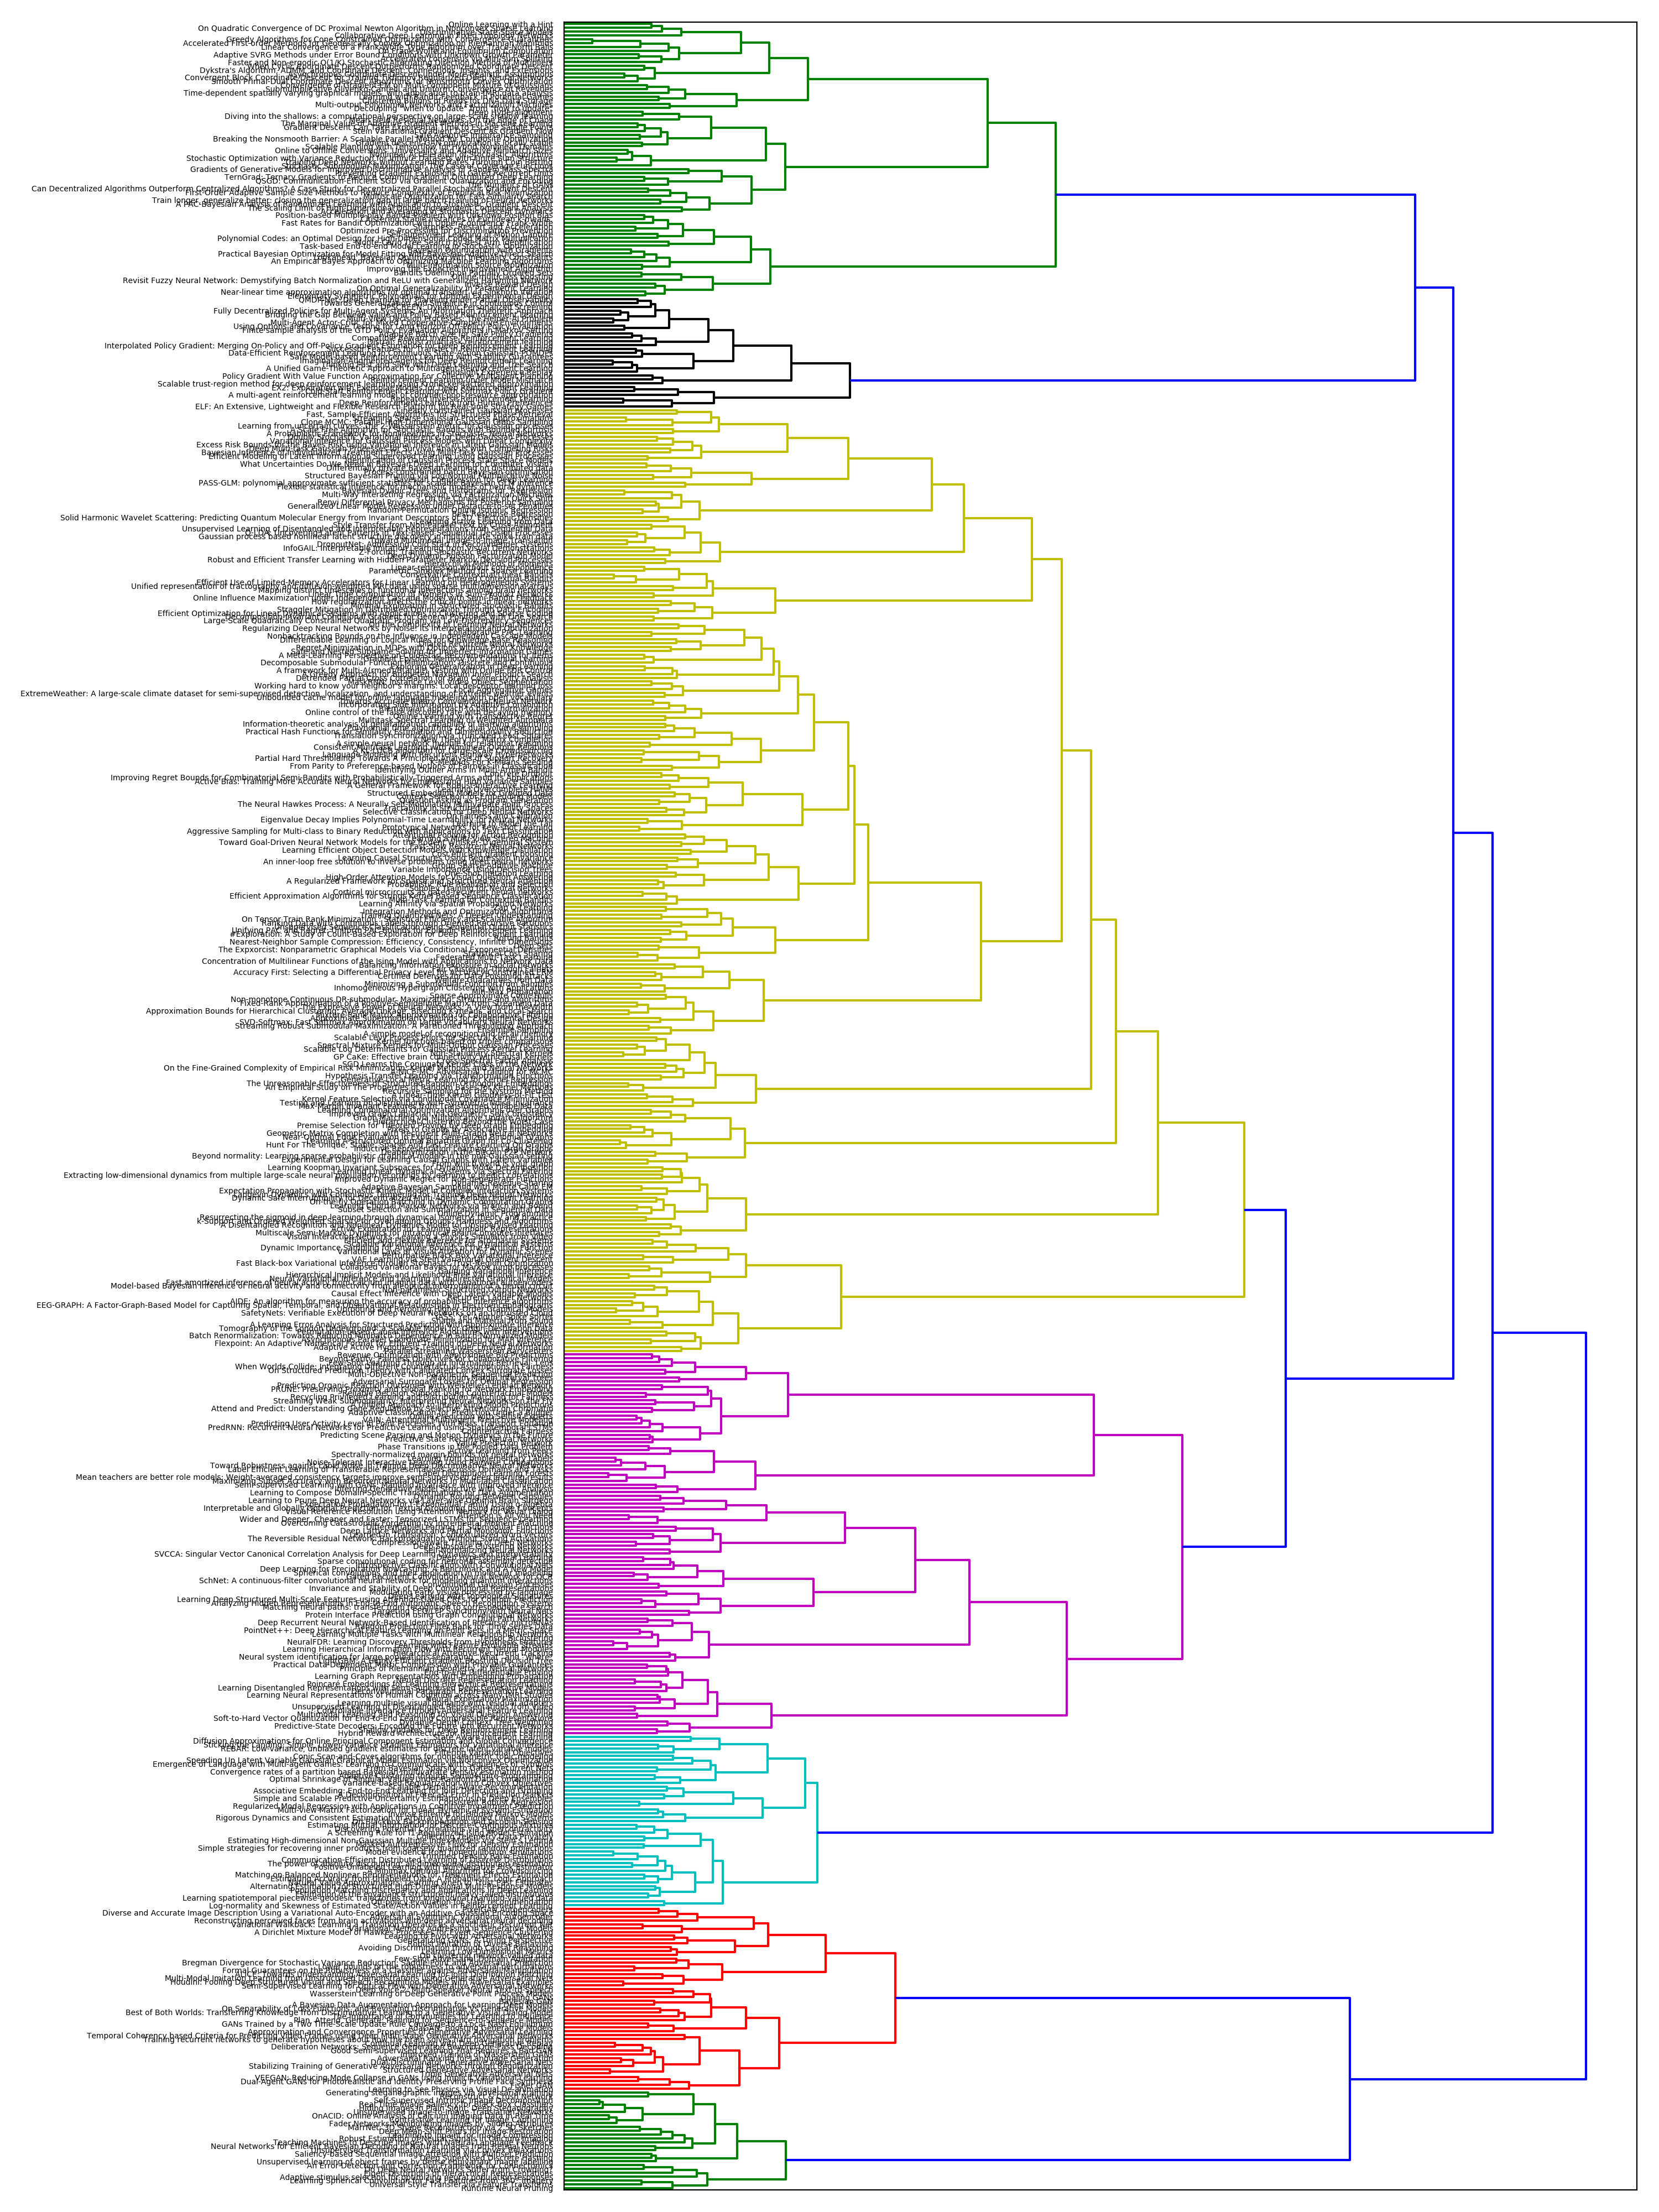
Hierarchical clustering dendrogram of NIPS 2017 papers using Ward’s method. Each paper title is shown on the left, with colored branches indicating different research clusters.
Lessons Learned
-
Domain Expertise Matters: Subjective evaluation of cluster quality improved significantly with ML domain knowledge. Understanding which concepts should be grouped together was crucial for parameter tuning.
-
Iterative Refinement: The custom stopword list required multiple iterations. Initial clustering revealed domain-specific common words that needed removal.
-
Visualization Importance: 2D projections and dendrograms were essential for validating cluster quality beyond quantitative metrics.
-
Hyperparameter Sensitivity: Small changes in TF-IDF parameters dramatically affected clustering results, highlighting the importance of careful tuning.
-
Research Trend Reflection: The cluster sizes accurately reflected 2017’s research priorities, with deep learning and reinforcement learning dominating the field.
References
- NIPS 2017 Conference
- Brandon Rose’s Document Clustering Tutorial - Foundational methodology
- TF-IDF Wikipedia
- K-means Clustering
- Ward’s Clustering Method
Technical Implementation
The complete analysis was implemented in Python using:
- Web Scraping: Custom Python scripts with requests/BeautifulSoup
- Text Processing: NLTK for tokenization, stemming, and stopword removal
- ML Pipeline: scikit-learn for TF-IDF vectorization and k-means clustering
- Visualization: matplotlib and mpld3 for interactive plots, scipy for dendrograms
The project demonstrates how unsupervised learning can reveal latent structure in academic literature, providing insights into research trends and topic relationships within a scientific conference.