Delphi
This is a writeup of the work I did in my research position at MIT. We created a framework called DELPHI that identifies “hidden gem” research papers - those destined to have significant impact but overlooked by traditional metrics. By analyzing how ideas spread virally across disciplines, DELPHI can spot potentially groundbreaking papers within just one year of publication.
Paper: https://www.nature.com/articles/s41587-021-00907-6
Code: https://github.com/timholds/MIT-Media-Lab-Neo4j
Group: https://www.media.mit.edu/projects/scaling-science/overview/
Press Release: https://www.media.mit.edu/articles/using-machine-learning-to-predict-high-impact-research/
Some excerpts from the press release:
“By tracking the early spread of ideas, we can predict how likely they are to go viral or spread to the broader academic community in a meaningful way.”
“Two papers can have the same number of citations, but highly impactful papers reach a broader and deeper audience”
“Instead of using one-dimensional measures, such as the number of citations, to judge a publication’s impact, DELPHI was trained on a full time-series network of journal article metadata to reveal higher-dimensional patterns in their spread across the scientific ecosystem.”
Background
The opportunity: The release of two massive citation datasets created an unprecedented chance to predict research impact at scale. Traditional metrics like citation counts are slow and biased - they often miss groundbreaking interdisciplinary work. Our insight was that truly impactful papers spread differently: they create ripples across academic boundaries, influencing fields far from their origin. By merging the Microsoft Academic Graph and Aminer Dataset, we could track these viral patterns and identify papers in the top 5% of “time-scaled node centrality” - essentially measuring how quickly a paper becomes structurally important in the knowledge network.
The main challenge
For context, citation datasets show relationships between authors of academic papers, like which authors worked together to write papers and which journals they got published in. In order to predict which papers are going to be important in the field later on, we wanted to think of citations as a time series problem.
 |
|---|
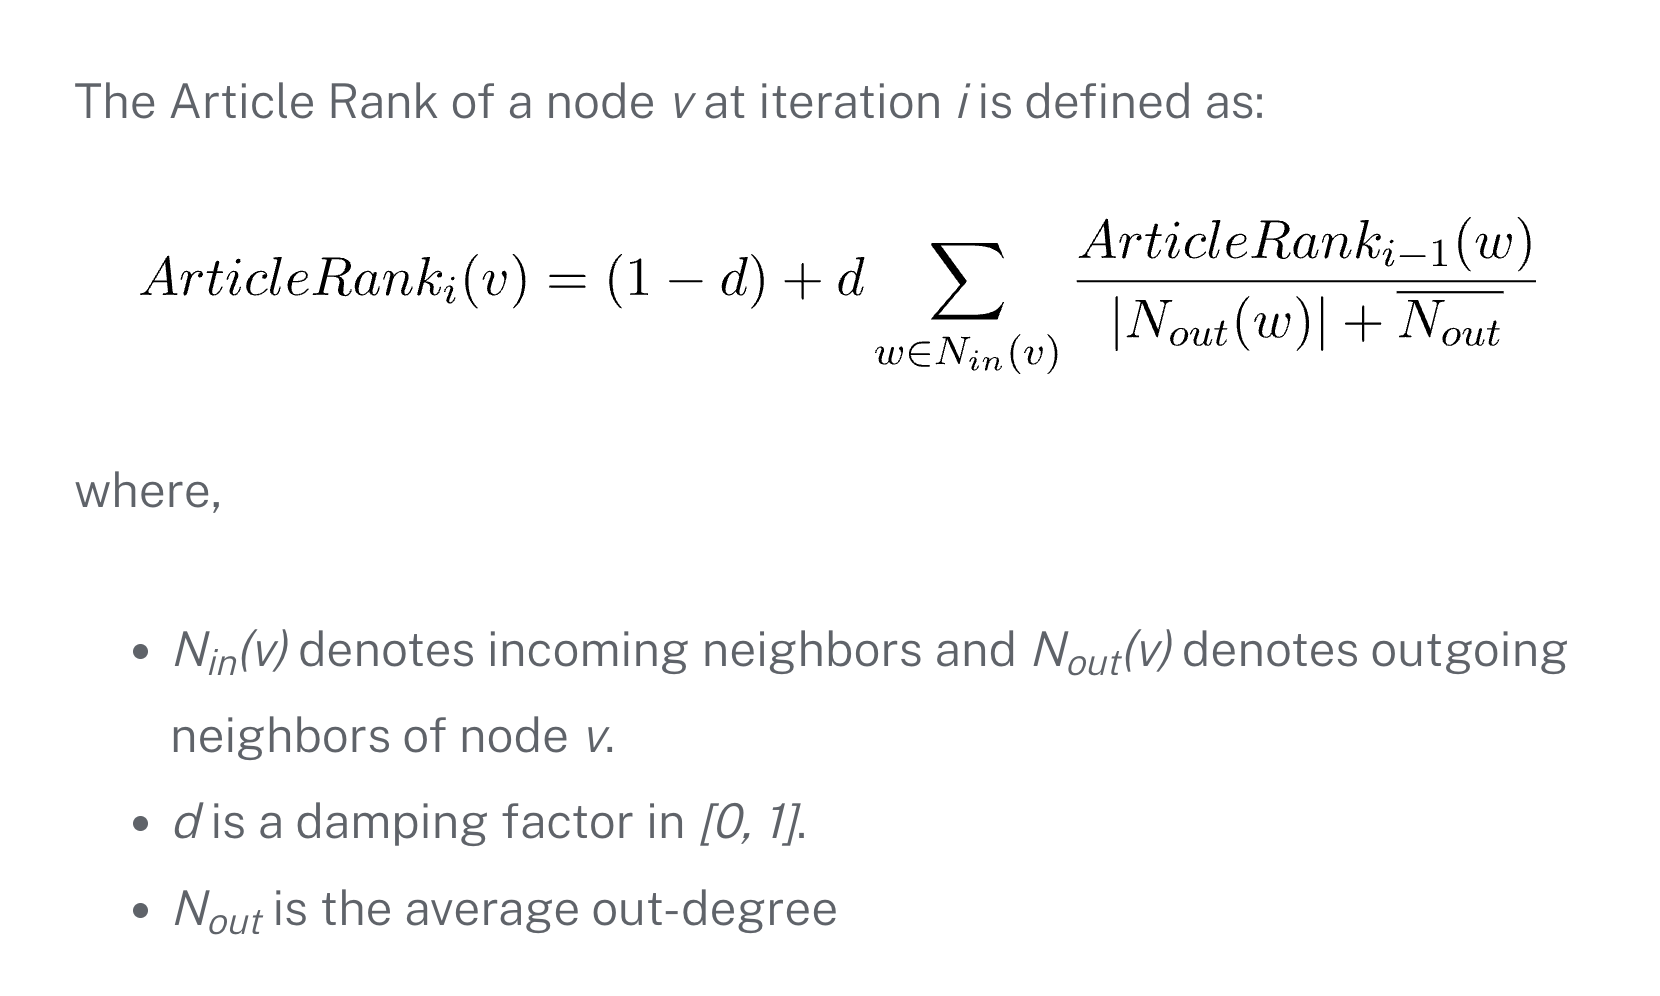
| ArticleRank computation was a key feature in our prediction model |
Since PageRank is the typical way to determine the importance of nodes in a graph, one key contribution was using a time-sensitive version of PageRank as a feature. I discovered that ArticleRank, a variant of PageRank specifically designed for citation networks, addressed exactly the biases we were concerned about.
The standard PageRank algorithm has problematic biases when applied to citation graphs - particularly the “firehose effect” where highly-cited papers with few references can artificially inflate their references’ importance. ArticleRank (which I’ve written about in detail) solves this by normalizing based on the average citation behavior in the network.
For Delphi, we took ArticleRank a step further by adding a time component. Instead of a single ArticleRank score, we computed temporal snapshots at 1, 3, and 5 years after publication. This gave us a trajectory of importance - papers showing rapid early ArticleRank growth often became field-defining works.
One thing I’m proud of is that in the process, I got ArticleRank added to the Neo4j Library. Once we knew that we were going to use a variant of ArticleRank, I opened the PR in the Neo4j library and got to briefly work with Mark Needham from the Neo4j developer relations team. We had a skype, I came with a test dataset and expected results, and he made the changes and refactored the old PageRank code at the same time.
Neo4j ArticleRank: https://neo4j.com/docs/graph-data-science/current/algorithms/article-rank/
My old Pull Request: https://github.com/neo4j-contrib/neo4j-graph-algorithms/issues/689
The method
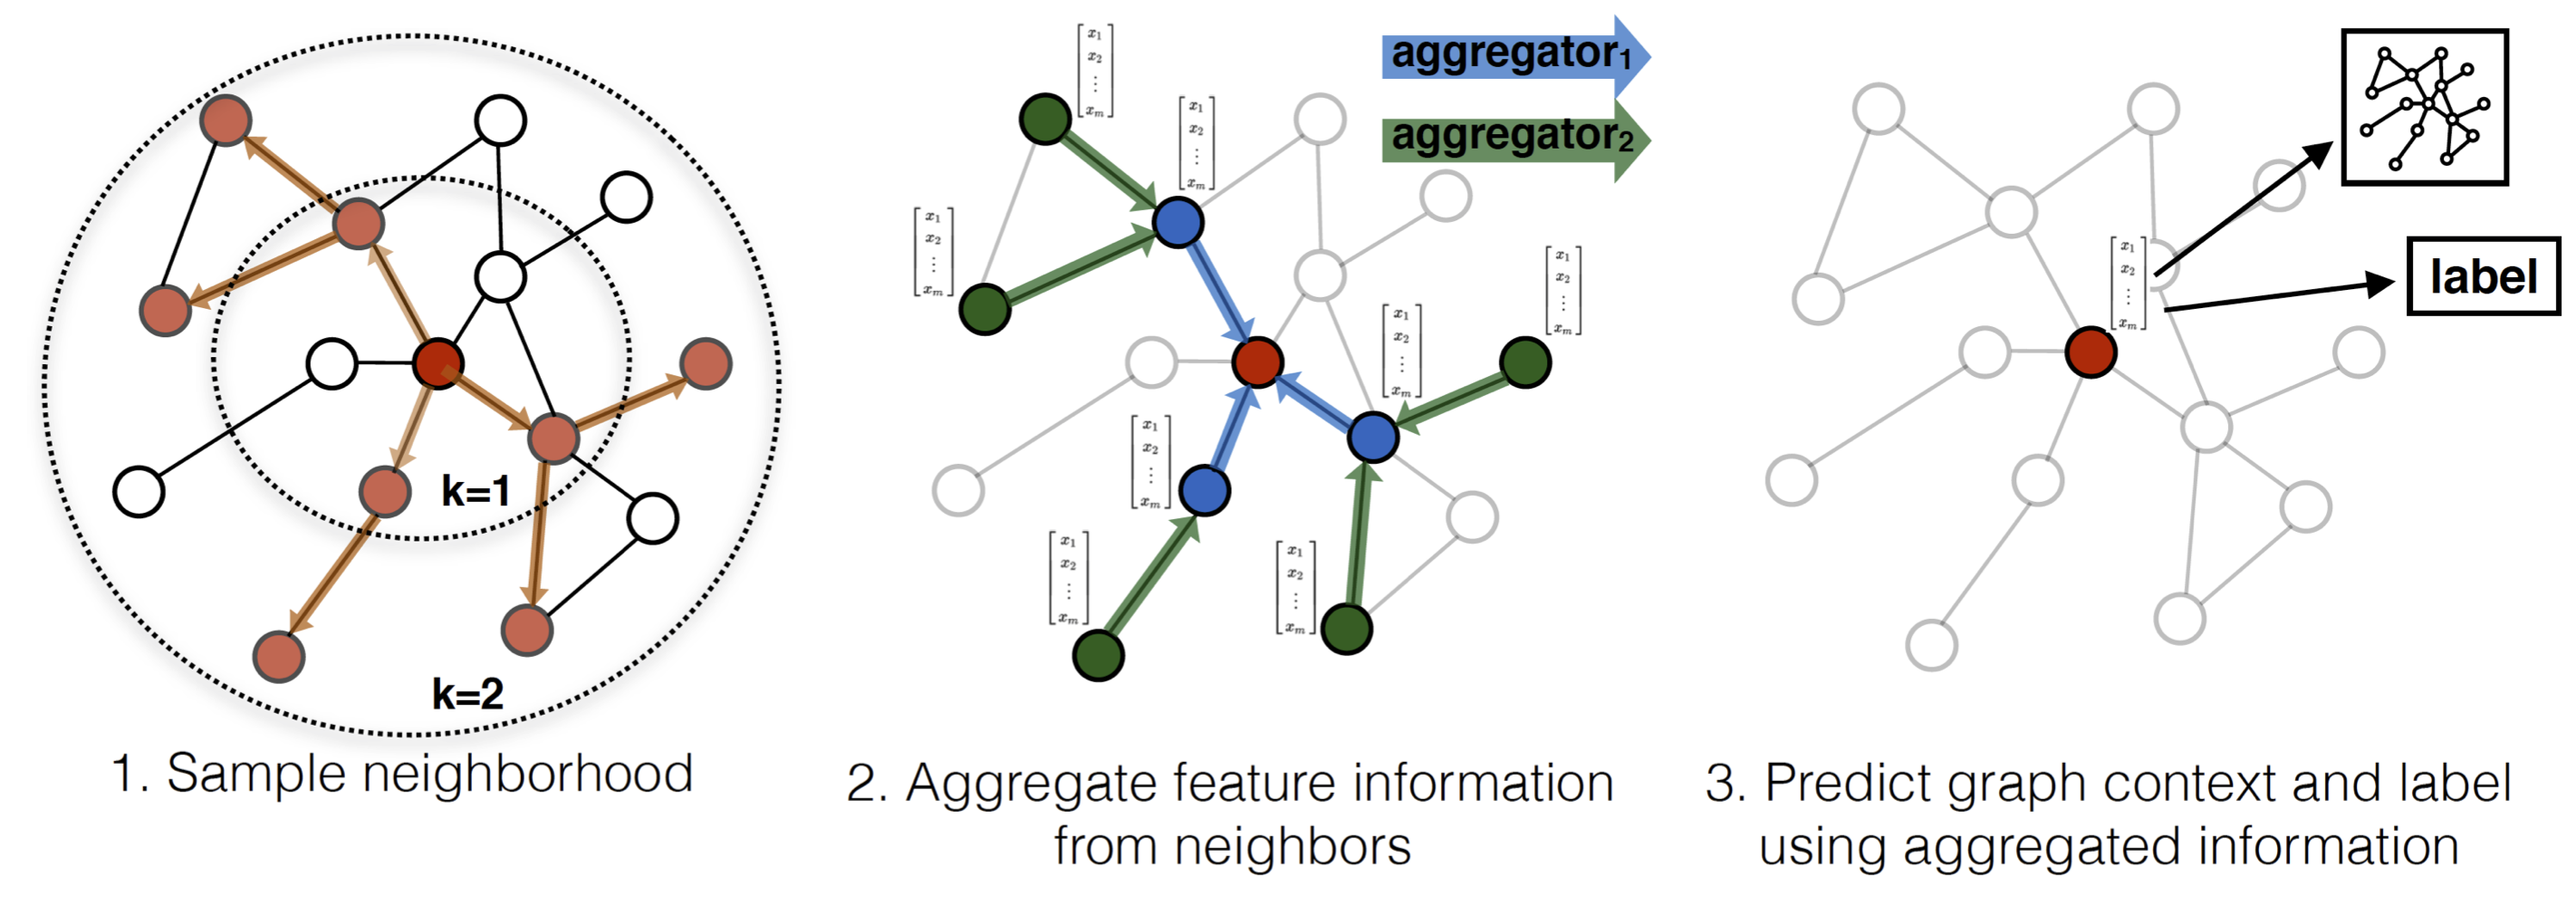
I ended up writing a bunch of cypher queries with py2neo to get the metadata into the graph database, and then used a combination of Python and cypher to create the features from the graph. To create the node embeddings, we used node2vec, which works pretty similarly to word2vec but instead of looking at windows of words in a sentence, it looks at which nodes show up together in the same random walk of a graph.
 |
|---|
| node2vec is a way to generate node embeddings from a graph |
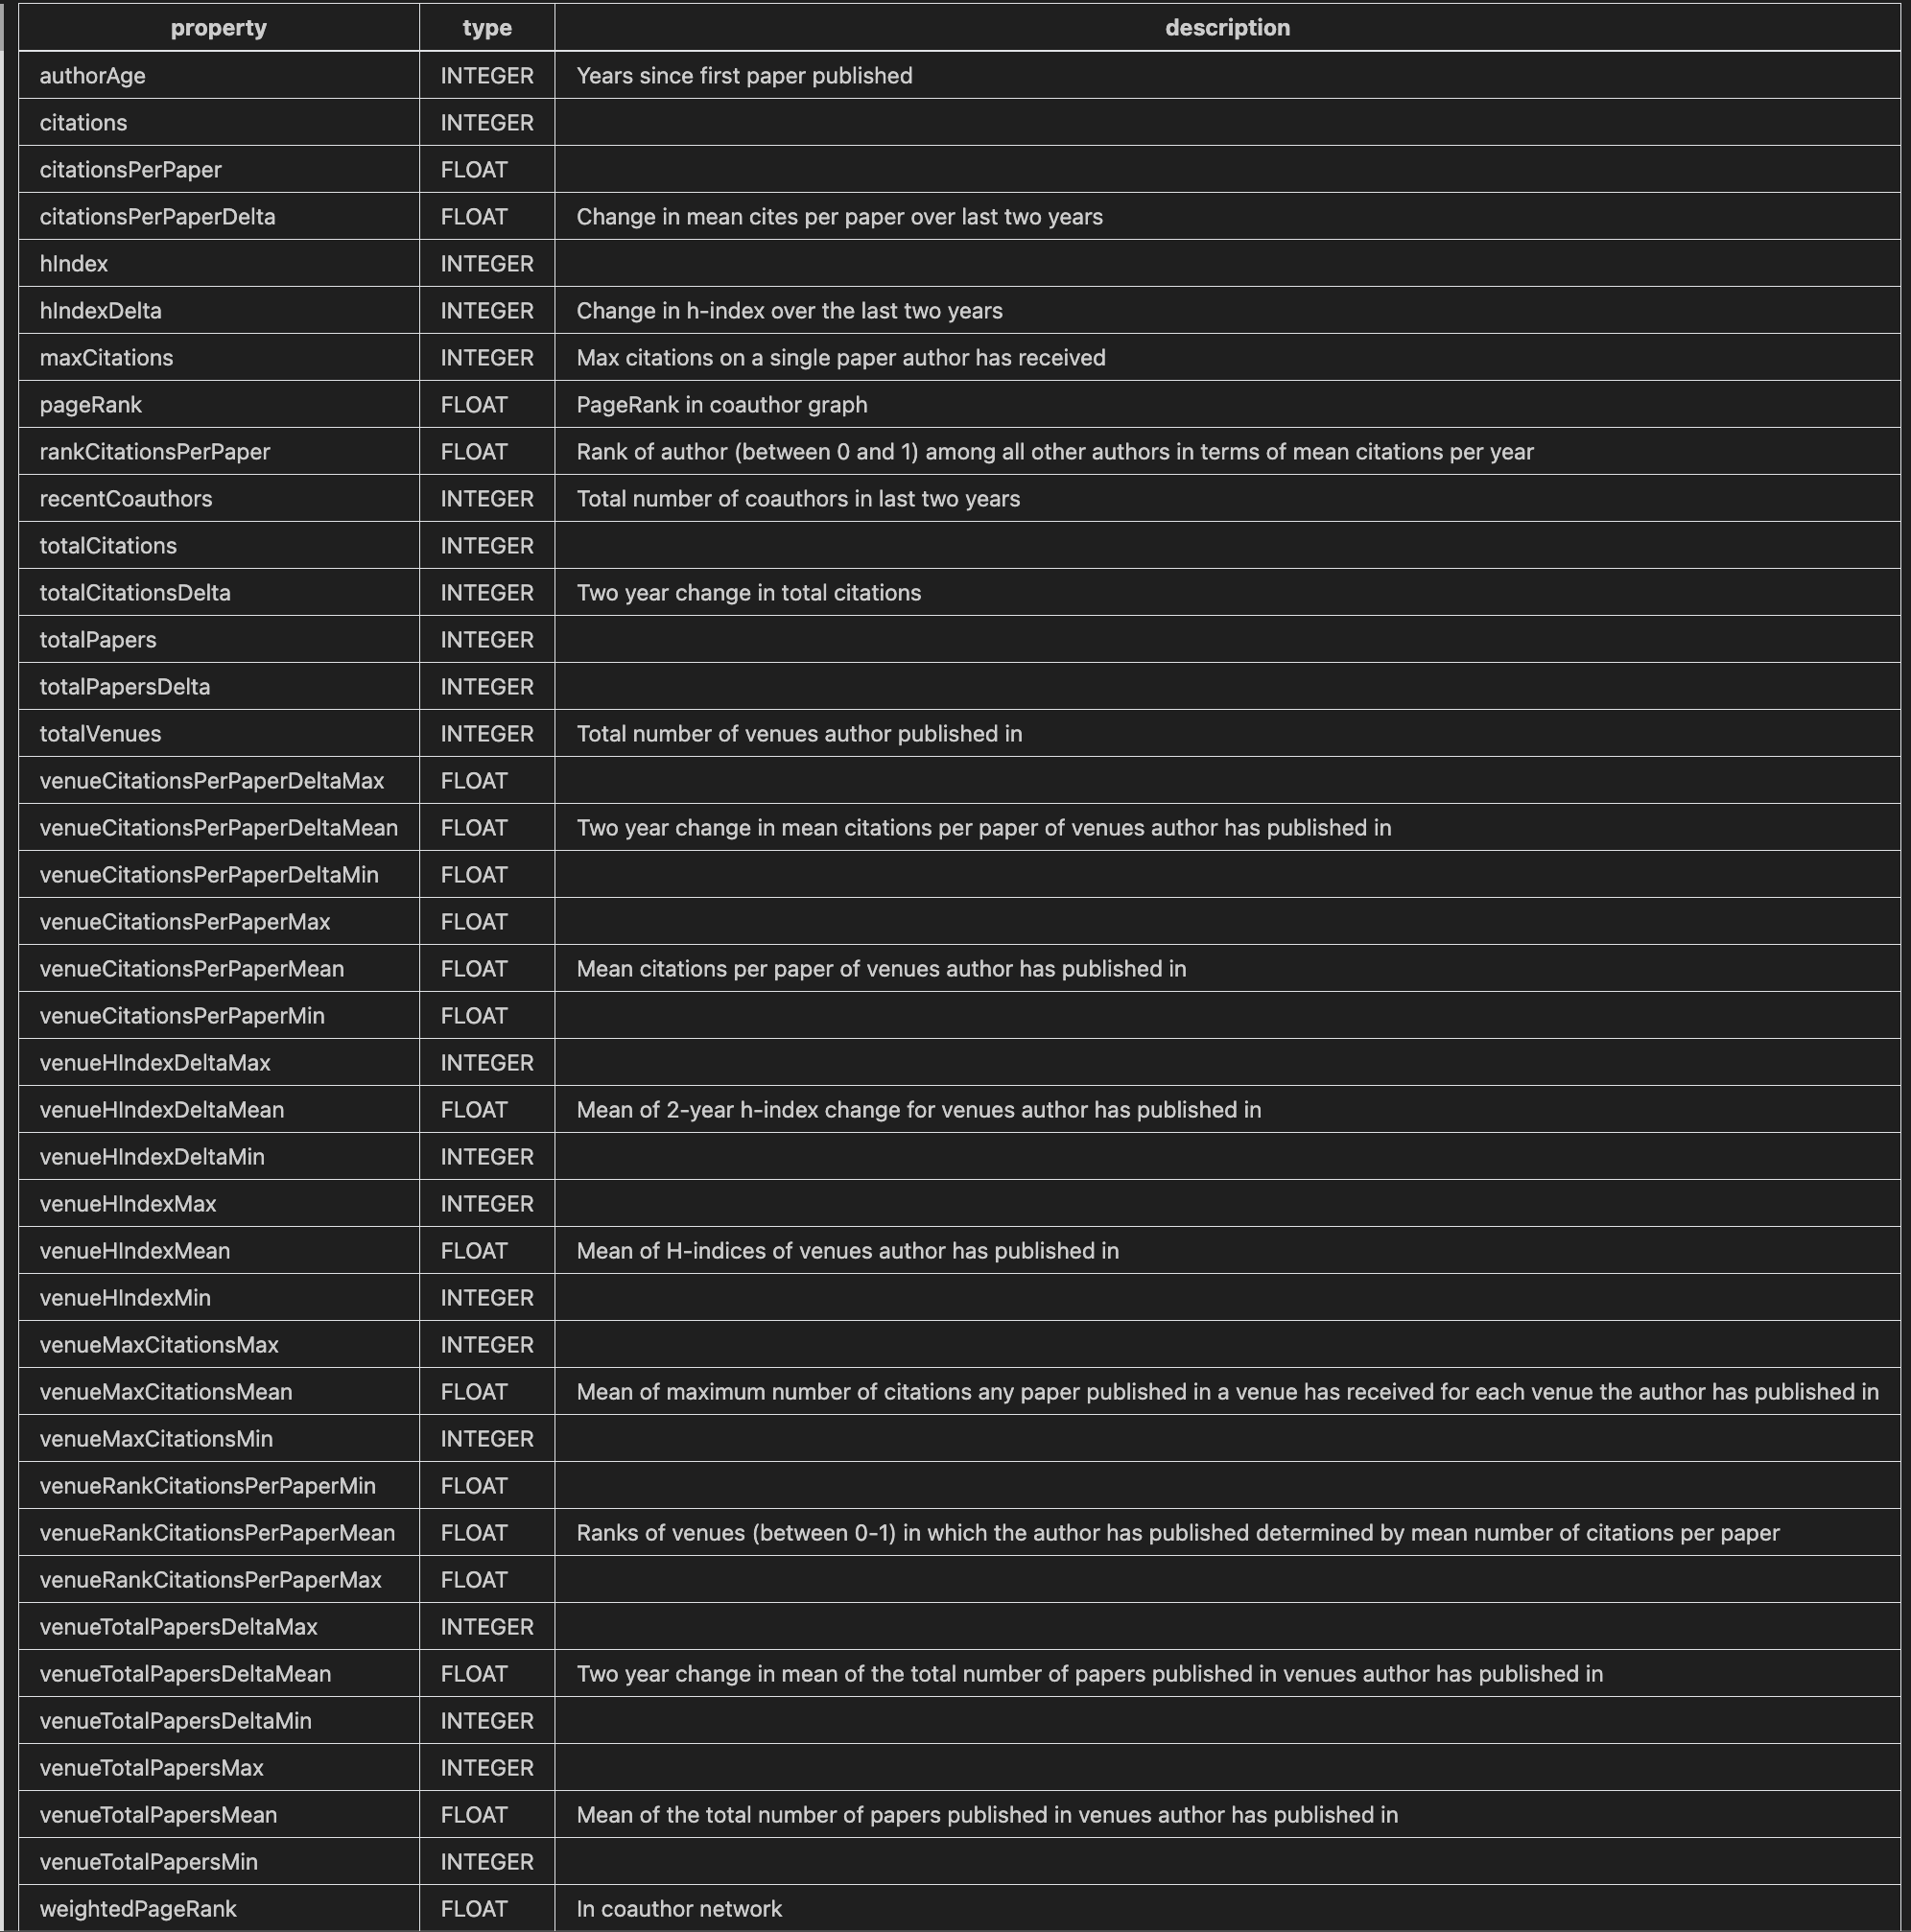
The model we trained was on a combinations of the graph embeddings and features we created from the graph. The custom features were things like the number of citations, the number of co-authors, and the number of papers published in a given year.
Here is a partial list:
 |
|---|
| Citation Graph Metrics as Neural Network Features |
Other challenges
Graph structure: Storing the full dataset of authors, papers, institutions, citations and co-authorships in a graph database ended up with hundreds of millions of nodes and over 1 billion edges.
As a result, we had to be careful in determining which things were a direct edge in the graph and which things we would calculate from the graph. For example, we had to decide if we wanted to treat co-authorship as a direct edge in the graph or if we wanted to find coauthors by crawling the AUTHORED_BY relation from papers in the graph. It’s much faster to precalculate things in the graph, but for the most part we were space constrained.
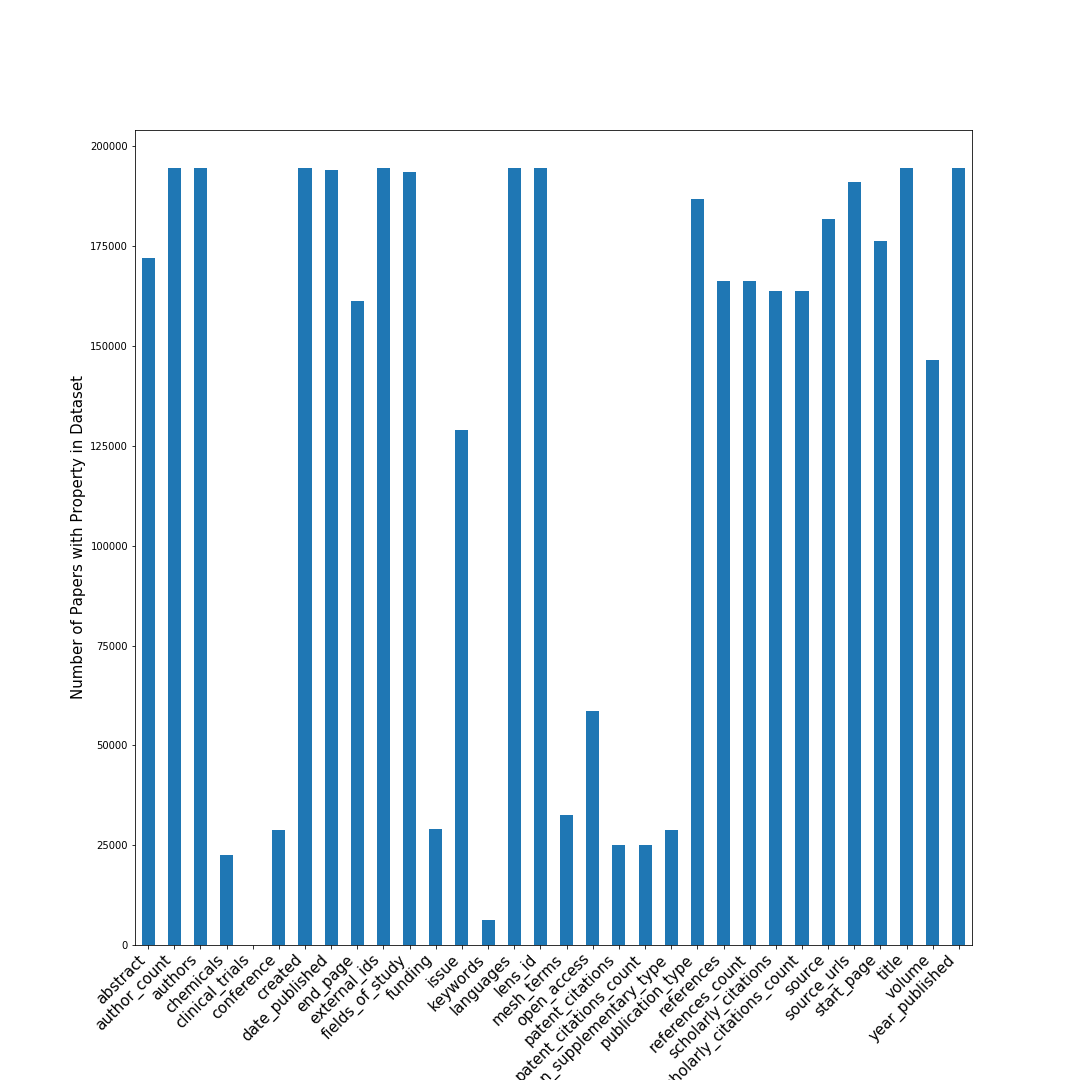
Data cleaning was surprisingly complex. Merging two massive datasets meant dealing with duplicate authors (same person published under different name variations) and deciding which metadata to keep. This unglamorous but crucial work taught me that real-world ML projects often succeed or fail on data quality, not model sophistication.
 |
|---|
| Frequency of metadata attributes in Lens1 dataset |
Evaluation was hard partially because the ideal output is sort of fuzzy. I mean how do you really define how impactful a paper ends up being especially when it comes to papers that are. Since our goal was to find the hidden gems, we ended up focusing our evaluation on a hand selected list of over 500 papers, tuning our input features and training until we got a model with good recall.
There’s bias in the citation metadata between different fields. When trying to numerically reason about the spread of ideas and techniques, we had to be careful not to let these metrics dominate. For example, physics papers sometimes have hundreds of authors, which leads to more connected co-authorship subgraphs but do not necessarily mean that the paper is more impactful.
Impact and Reflections
DELPHI’s ability to identify high-impact research early has real-world implications. The MIT article notes it could help governments, philanthropies, and venture capitalists make better funding decisions - potentially accelerating scientific progress by directing resources to promising but overlooked research. By finding over twice as many eventual high-impact papers compared to citation counting alone, and discovering 60% of “hidden gems” that traditional metrics miss entirely, DELPHI offers a less biased way to evaluate research potential.
On a personal level, this project was transformative. I got to pair program with researchers far more experienced than me, which gave me tremendous confidence in tackling complex problems. There was real excitement about potentially changing how science gets funded and recognized. Plus, being surrounded by brilliant minds taught me to think differently - like when a graph database developer told me: “graph databases are like water: there is no start and end, just the connections between pieces and the mass that will fall into the shape of the container.”
Working directly with the Neo4j team to get ArticleRank integrated into their library showed me what careful, scalable software engineering looks like. It wasn’t just about writing code - it was about understanding the broader impact of our work on the scientific community.